There are many people in the Node-RED community that ask about doing debugging of flows. Many use the tried and true method:
That’s the current state of debugging flows in Node-RED.
What is missing?
A possibility to activate debugging without having to redeploy or add deploy nodes. Most of the time I don’t know where the bug is, so having to add debug nodes everywhere makes flows confusing.
(I then always end removing debug nodes again … only having to readd them once errors occur.)
Most of the time, it’s hard to figure out what is going wrong. So for those situations, it would be nice to be able to debug everything dynamically.
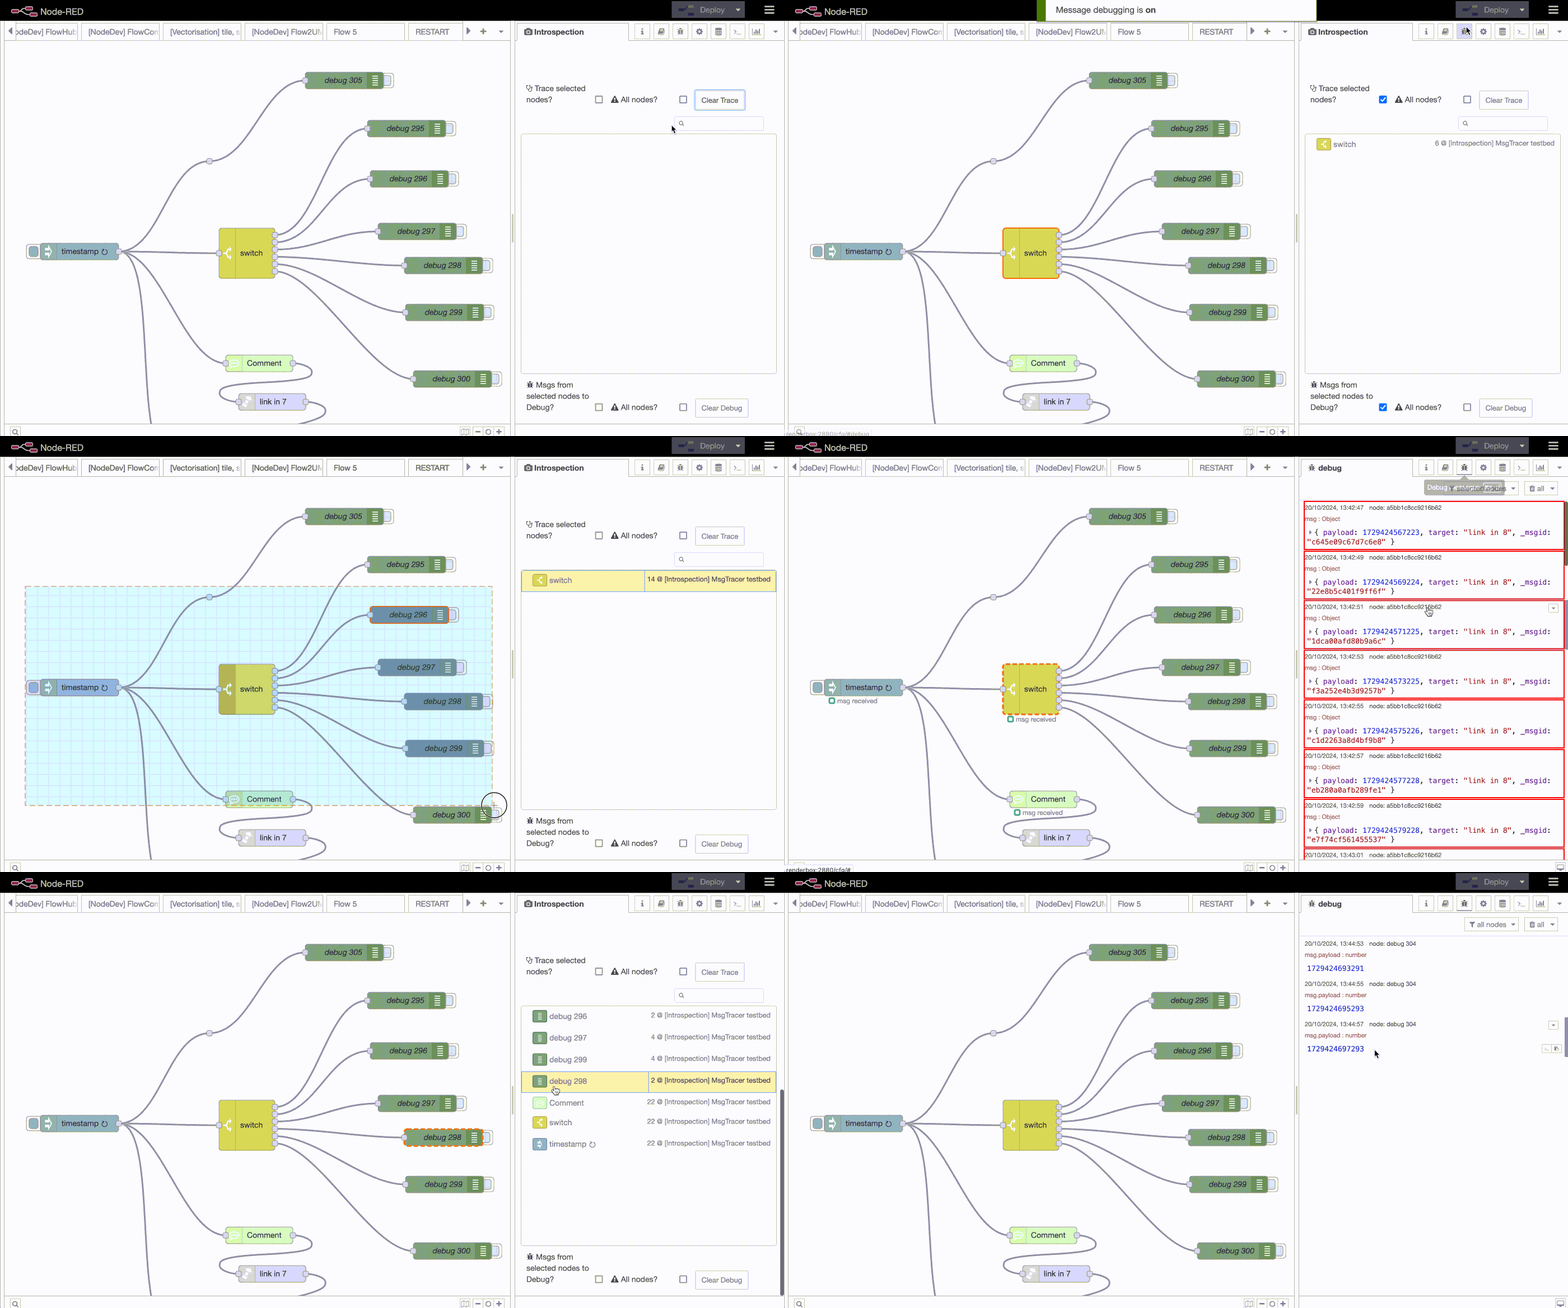
That is what the debugger functionality of the introspection node package now offers:

First thing to note: I never pressed the deploy button, this all works without deploying the flow. Hence this is a dynamic debugger, or just-in-time debugger. It is activated on the server side at runtime and deactivated at runtime.
The debug functionality is split into two different components: trace and debug.
Trace shows the flow of messages through the flows within Node-RED using the status feature of a node. The status of a node the receives a message becomes ‘msg received’. This will replace any existing status for that node. This might be undesirable but this feature is not meant to be on all the time. Trace also lists each node that received a message in tree list panel. Included is a message count and the nodes flow name. A single click on the node will highlight the node and a double click will open the nodes edit panel.
Debug component sends the messages received by the selected nodes to the Node-RED debug panel. The nodes that are being debugged in this way may be a different set than those that are being traced. It is possible to trace all nodes but - at the same time - only send the messages of a subset of nodes to the debug panel.
DISCLAIMER: this feature can flood the editor with messages depending on the density of messages through a flow - use with care. Always start by tracing a selection of nodes, this creates the least amount of traffic. Always start small and then grow out. The debug feature requires more editor resources so only activate it when you are sure that a responsible amount of messages are being traced.
WARNING: This feature must be deactivated before closing the editor else the server will continue to send messages to the editor. If you do close the editor and forget to stop the debugger functionality, open the editor again and toggling the functionality on and off - that will remove all hooks for this feature.
Remember to only use this for short periods of time or for a very limited number of nodes (one is best!). This is not a monitoring tool, this is a debugging tool.
Messages can be highlighted (by a red border) in the debug panel when nodes are clicked on in the trace panel. All messages related to that node is then shown in the debug panel. Of course, this only works if node is being traced and debugged at the same time.
It was surprisingly simple to create this, no changes to the Node-RED core had to be made. All I did was hook into the message handling hooks and have my hook communicate with the editor using the RED.comms.publish(..) and RED.comms.subscribe(..) functionality.
Originally I only wanted the status message to appear ‘msg received’ on each node, for that I only used the node.status({..}) API but that soon go confusing and I created a treeList to display nodes and their call counts.
I did cheat in sending the messages to the debug panel, there is no official API for doing that and I had to have a look into the debug node to find out what it does. My original idea was to use the children feature of the treeList widget, but that would have meant emulating what the debug panel already does: syntax highlight, collapse of data, highlighting of nodes, etc.
One other cheat was the highlighting of messages in the debug panel. I did this with a CSS property change and is definitely not recommended. The reason I cheated because message highlighting in the debug panel isn’t possible.
In the end it was surprisingly simple to put together because Node-RED is so flexible and has a wonderful API that can be utilised. There was nothing I needed to change in Node-RED itself, so this should work with all versions of Node-RED.
Forum Post One, Forum Post Two and orignal Slack conversation.
There was a lot of discussion around performance and it is true, tracing all messages causes the editor to slowdown and if then all messages are sent to debug … not good. So that’s why the select of nodes became the default and if you want to debug/trace all nodes, then there are extra “I am sure” checkboxes.
The server itself is affected by this feature. Meaning that if it’s on, then yes the server is doing much more network communication with the editor but if the feature is turned off, server performance is not affected. All message hooks are removed and hence there is no overhead.
Happy Debugging!